Struggling with WASSCE Maths? Stop guessing. Let’s fix the gap step by step.
Graphs in Core Maths: 6 Mistakes Students Must Avoid
In many Ghanaian SHS classrooms, the moment a Core Maths question says “draw the graph” or “use your graph to find,” some learners become quiet. Not because they do not know anything. Many of them know the formula. They can even form the table of values. But when it is time to choose a scale, plot points, join the curve, or read an answer from the graph, the marks begin to leak slowly.
In WASSCE Core Mathematics, a graph is not just a picture drawn to fill space. A graph is a mathematical answer. Every small action matters: the axis, the scale, the plotting, the line or curve, the labeling, and the reading from the graph.
This is why a student may calculate correctly but still lose marks. The calculation may be right, but the graph may be weak. And once the graph is weak, every answer read from that graph becomes doubtful.
This Maths Clinic post diagnoses six costly graph mistakes SHS students must avoid before WASSCE and shows how to correct them step-by-step.
| Teacher’s clinic note: When a graph question goes wrong, do not only blame the final answer. Check the scale, the plotting, the joining, and the reading. That is where many hidden marks escape. |
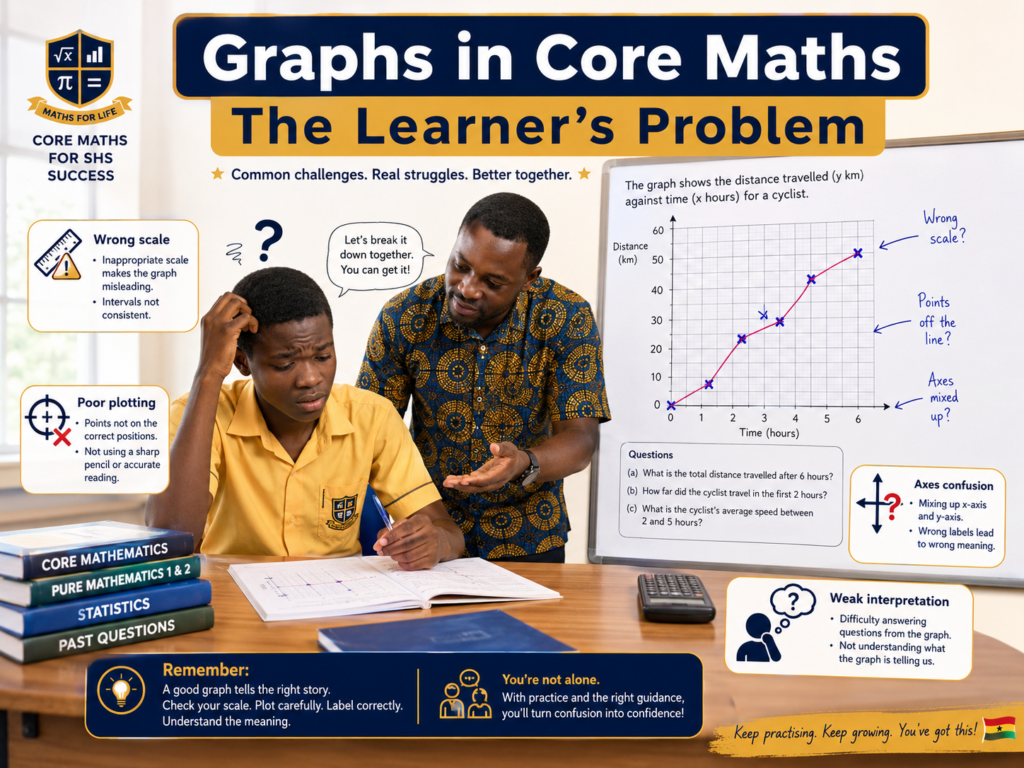
The Learner’s Problem
Many learners struggle with graphs in Core Maths because they treat graph work as drawing, not as mathematical communication.
A student may know that a straight-line graph follows the form
y = mx + c
But the same student may still lose marks because he or she:
- chooses a poor scale
- does not label the axes clearly
- plots points carelessly
- uses a ruler wrongly or does not use one at all
- joins points badly
- reads values from the wrong axis
- forgets that graph answers are usually approximate
So the learner’s problem is not always a lack of knowledge. Sometimes, the learner knows the topic but does not know the graph rules that protect the marks.
2. Why Did the Mistake Happen?
Most graph mistakes happen because learners jump into plotting before understanding what the graph is supposed to show. They see a table of values and quickly start marking points without first planning the graph.
The hidden gap
The hidden gap is usually one or more of these:
- poor understanding of the Cartesian plane
- weak knowledge of positive and negative values on axes
- difficulty choosing a suitable scale
- poor reading of coordinates
- weak ruler and pencil discipline
- Rushing through graph interpretation questions
This is why the same learner may solve algebra correctly on paper but fail when the answer must be shown graphically.
3. What WAEC or the Curriculum Reveals
WASSCE core mathematics graph questions normally test more than drawing. They test accuracy, interpretation, and reasoning.
From the way graph questions are commonly set, learners are expected to:
- Complete a table of values correctly
- Choose a suitable scale for both axes
- plot ordered pairs accurately
- draw a straight line or smooth curve where required
- Read values from the graph
- estimate roots, gradients, medians, quartiles, or other values when required
- explain or use what the graph shows
The curriculum direction also supports problem-solving and application. This means a learner must not only plot points; the learner must understand what the graph is saying.
| WAEC-style warning: If your scale is poor, your plotting will suffer. If your plotting suffers, your line or curve will suffer. If your line or curve suffers, the values you read from the graph will also suffer. |
4. Simple Explanation
A graph is like a classroom map. If the map has no clear scale, nobody can use it properly. In the same way, if your graph has a poor scale or unclear axes, your answer becomes difficult to trust.
For graph work, always think about four things before you start:
- What values will go on the horizontal axis?
- What values will go on the vertical axis?
- What scale will make the graph neat and wide enough?
- Am I drawing a straight line, a smooth curve, a bar chart, or a cumulative frequency curve?
A good graph is not necessarily the graph with the finest decoration. A good graph is clear, accurate, properly labeled, and easy to read.
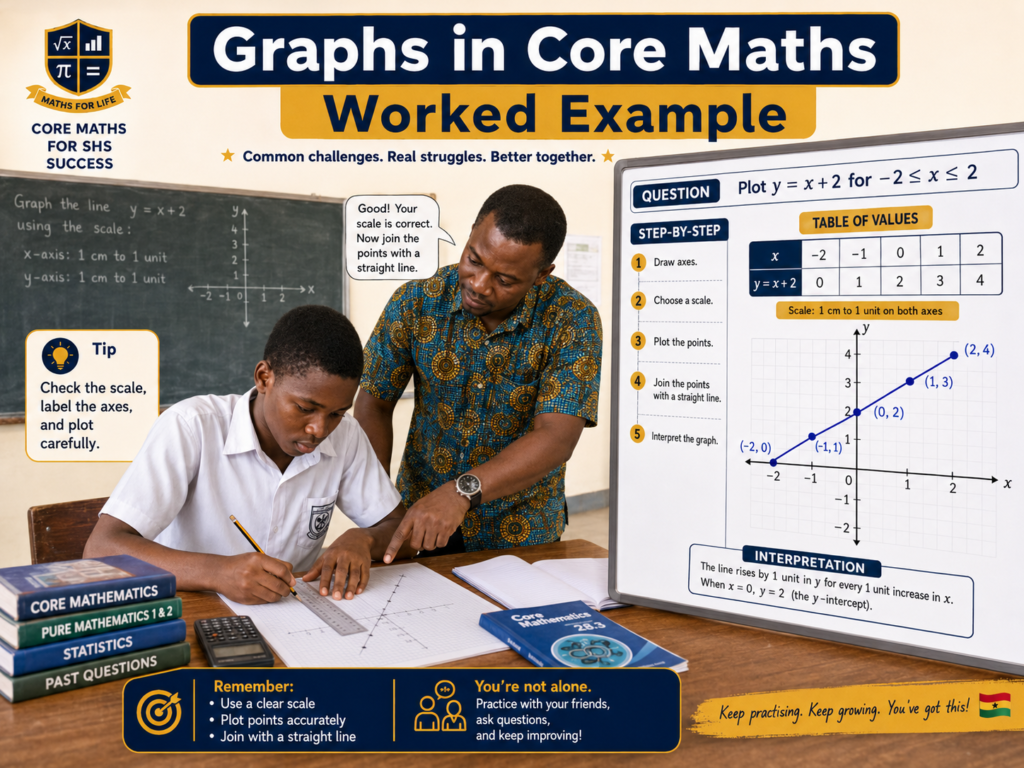
5. Worked Example
Example: Drawing a linear graph
Complete the table of values for the function below and draw the graph for x = -2, -1, 0, 1, 2, 3.
y = 2x + 1
| x | -2 | -1 | 0 | 1 | 2 | 3 |
| y = 2x + 1 | -3 | -1 | 1 | 3 | 5 | 7 |
| Ordered pairs | (-2, -3) | (-1, -1) | (0, 1) | (1, 3) | (2, 5) | (3, 7) |
Step 1: Substitute each x-value correctly
When x = -2: y = 2(-2) + 1 = -4 + 1 = -3
When x = -1: y = 2(-1) + 1 = -2 + 1 = -1
When x = 0: y = 2(0) + 1 = 1
When x = 1: y = 2(1) + 1 = 3
When x = 2: y = 2(2) + 1 = 5
When x = 3: y = 2(3) + 1 = 7
Step 2: Choose a suitable scale
The x-values run from -2 to 3. The y-values run from -3 to 7. A neat scale can be:
- Horizontal axis: 1 cm represents 1 unit
- Vertical axis: 1 cm represents 1 unit
Step 3: Plot the ordered pairs
- (-2, 3)
- (-1, -1)
- (0, 1)
- (1, 3)
- (2, 5)
- (3, 7)
Step 4: Join the points correctly
Since y = 2x + 1 is a linear function, the graph should be a straight line. Use a ruler to draw one neat straight line through the plotted points.
Step 5: Label the graph
Label the horizontal axis as x and the vertical axis as y. Write the graph title if required:
Graph of y = 2x + 1
6. Common Wrong Approach
A common wrong approach is for a learner to complete the table correctly but draw the graph carelessly. For example:
- using different scales without showing them clearly
- plotting (x, y) as if it is (y, x)
- Joining a straight-line graph freehand without a ruler
- forcing a smooth curve through points that should form a straight line
- forgetting to label the axes
- reading the answer from the wrong axis
Why does this approach lose marks
In graph work, the examiner is not only checking whether the final answer is close. The examiner is checking the process. If the graph is untidy, badly scaled, or wrongly labelled, the learner may lose marks even if some calculations are correct.
7. Correct Method
The correct method is to treat every graph question like a step-by-step construction, not like ordinary sketching.
The Maths Clinic graph method
Step 1: Read the instructions carefully
Check whether you are drawing a line graph, curve, bar chart, cumulative frequency curve, or another graph type.
Step 2: Complete the table of values
Substitute carefully. Watch negative signs, brackets, squares, fractions, and decimals.
Step 3: Plan your scale
Choose a scale that uses a good part of the graph paper. Do not squeeze the graph into one small corner.
Step 4: Label both axes
Show the variable and unit where necessary. For example, time (seconds), distance (meters), class boundary, or cumulative frequency.
Step 5: Plot accurately
Use sharp pencil marks. Check each coordinate before moving to the next point.
Step 6: Join correctly
Use a ruler for a straight-line graph. Use a smooth curve for curves and cumulative frequency curves.
Step 7: Read from the graph carefully
Use a ruler or dotted guidelines when reading values from the graph.
Step 8: State the answer properly
If the answer is estimated from a graph, do not force unnecessary exactness. Use a sensible approximate value.
8. The 6 Costly Graph Mistakes Students Must Avoid
Mistake 1: Choosing a poor scale
Some learners choose scales that make the graph too small, too squeezed, or difficult to read. A good scale should allow the graph to occupy a reasonable part of the graph paper.
Correction: Before drawing, check the lowest and highest values on each axis. Then choose a scale that is simple, consistent, and easy to read.
Mistake 2: Mixing up the x-axis and y-axis
A learner may plot (2, 5) as if it means move 2 along the horizontal axis and 5 up the vertical axis. This reverses the coordinate.
Correction: Remember: in (x, y), the x-value goes across first, and the y-value goes up or down second.
Mistake 3: Plotting points carelessly
One small plotting error can bend the whole graph wrongly. This is serious when the learner must read roots, gradients, medians, or estimates from the graph.
Correction: Plot with a sharp pencil. After plotting, check each point against the table before joining.
Mistake 4: Joining points wrongly
Some students join straight-line graphs with freehand curves. Others join curves with broken straight segments. This changes the meaning of the graph.
Correction: Know the graph type. Linear equations need straight lines. Quadratic graphs usually need smooth curves. Cumulative frequency graphs need smooth increasing curves.
Mistake 5: Reading answers from the wrong place
A learner may read from the x-axis when the question asks for y or read from the y-axis when the question asks for x. This is common in graph interpretation.
Correction: Underline what the question asks for. If it asks for x when y is given, start from the y-value, move across to the graph, then move down to the x-axis.
Mistake 6: Forgetting labels, units, and the title
A graph without proper labels is incomplete. The examiner must know what each axis represents.
Correction: Label axes clearly and include units where needed. If the question requires a title, write it neatly above the graph.
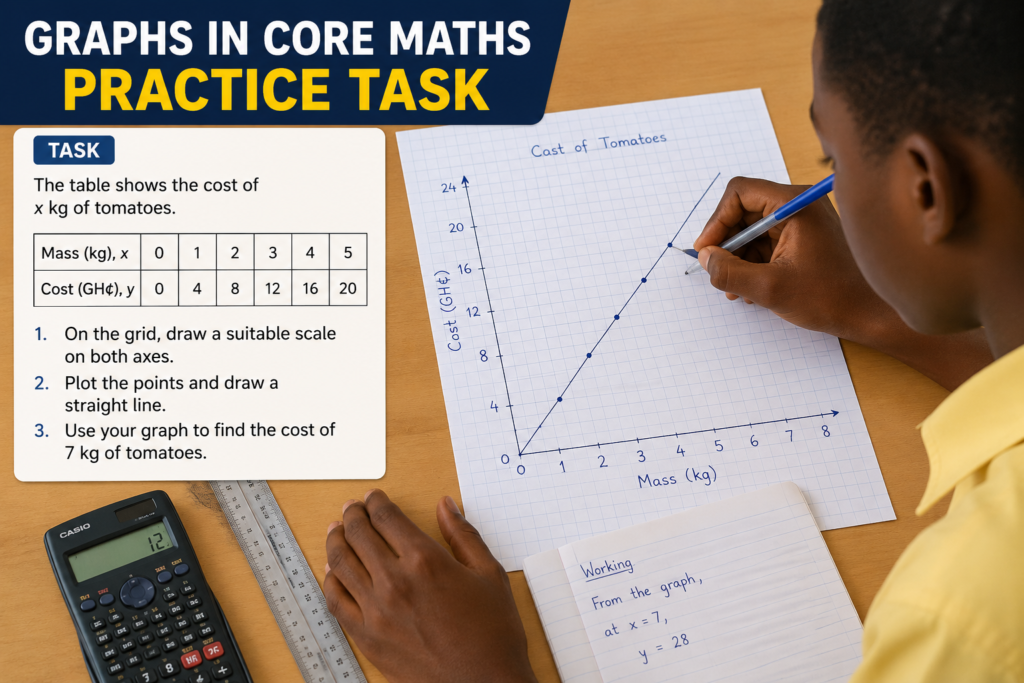
9. Practice Task
Try these questions before checking the solutions. Do not rush. The aim is not only to get the answer but also to practice the graphing habit that protects marks.
Question 1: Linear graph table
Complete the table of values for y = x + 2 for x = -2, -1, 0, 1, 2. Then state the ordered pairs to be plotted.
Question 2: Reading coordinates
A point P has coordinates (4, 3). Explain how to locate P on the Cartesian plane.
Question 3: Graph interpretation
A straight-line graph passes through the points (0, 2) and (3, 8). What is the gradient of the line?
Question 4: Scale decision
You are drawing a graph where x-values run from 0 to 10, and y-values run from 0 to 100. Suggest a suitable scale for each axis.
Practice Task Solutions
Solution to Question 1
y = x + 2
x = -2: y = -2 + 2 = 0
x = -1: y = -1 + 2 = 1
x = 0: y = 0 + 2 = 2
x = 1: y = 1 + 2 = 3
x = 2: y = 2 + 2 = 4
The ordered pairs are:
(-2, 0), (-1, 1), (0, 2), (1, 3), (2, 4)
Solution to Question 2
For P(4, 3), move 4 units to the right on the x-axis. Then move 3 units down because the y-value is negative. Mark the point there as P.
Solution to Question 3
The gradient formula is:
Gradient = change in y / change in x
Gradient = (8 – 2) / (3 – 0)
Gradient = 6 / 3 = 2
So, the gradient is:
2
Solution to Question 4
One suitable scale could be the following:
- Horizontal axis: 1 cm represents 1 unit
- Vertical axis: 1 cm represents 10 units
This scale is simple and easy to read. It also allows the graph to occupy a good part of the graph paper.
FAQ: Graphs in Core Maths
Why do students lose marks in graph questions?
Students lose marks because of poor scales, inaccurate plotting, wrong labelling, careless joining, and wrong reading from the graph.
Must I always use a ruler for graphs?
Use a ruler for straight-line graphs and for reading values from the graph. Curves should be drawn smoothly, not with broken ruler segments.
What scale should I use in WASSCE graph questions?
Use a scale that is simple, consistent, and allows the graph to cover a good part of the graph paper. Avoid awkward scales that make reading difficult.
Why is labeling important in graph work?
Labels show what each axis represents. Without labels, the graph becomes incomplete and difficult to interpret.
How can I improve in Core Maths graphs?
Practice completing tables, choosing scales, plotting points, joining correctly, and reading values from the graph. Do not practice drawing alone; practice interpreting, too.
Conclusion: A Good Graph Protects Your Marks
In core maths, graph questions are not there to punish students. They are there to test whether the learner can organize information, draw accurately, and read mathematical meaning from a diagram.
The painful part is that many learners lose marks not because they know nothing, but because they ignore small graph habits. They chose a weak scale. They forget labels. They plot carelessly. They join points incorrectly. They read from the wrong axis.
These are not impossible mistakes to correct. They are clinical mistakes. Once the learner knows where the marks are leaking, the learner can fix the habit and improve.
So the next time you meet a graph question, do not rush. Read. Plan. Scale. Plot. Join. Label. Read carefully.
That is how graph work becomes less frightening and more understandable.
Stop guessing. Start understanding.