Struggling with WASSCE Maths? Stop guessing. Let’s fix the gap step by step.
Statistics Clinic
Every Statistics Clinic lesson in one place: frequency tables, averages, cumulative frequency, ogives, histograms, pie charts and conclusions, built on WAEC Chief Examiners’ reports.
Statistics carries some of the most reliable marks on the WASSCE Mathematics paper: a table, a graph and two or three readings, every year. It is also where WAEC’s Chief Examiners report the same losses year after year.
The Statistics Clinic fixes those losses one at a time, using what the examiners actually wrote. Every lesson has diagrams, worked answers, practice and a box on what the Chief Examiner reported and how to win those marks back. No magic: just the right habits, practised.
📋 What the WAEC Chief Examiner reported
- 2025: “constructing cumulative frequency table from given data distribution” and “making deductions from real life problems” were listed weaknesses.
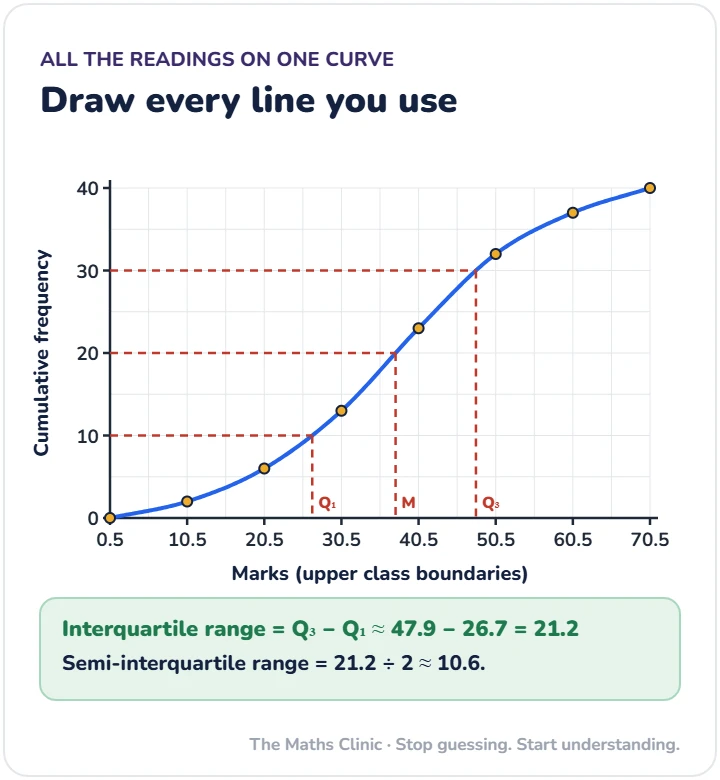
- 2020: candidates drew the ogive but “could not interpret their graph by showing evidence of reading”.
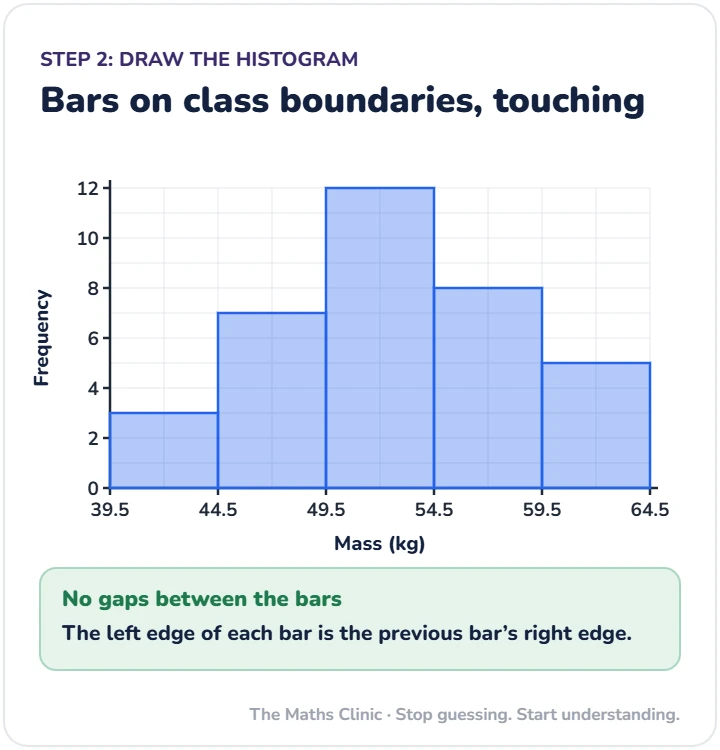
- 2020 (Elective): histograms drawn with midpoints instead of class boundaries; 2019: “inability to differentiate between frequency and cumulative frequency”.
How to win these marks back
- Build tables with every column, and check the totals.
- Use class boundaries for histograms and ogives.
- Draw and label every reading line.
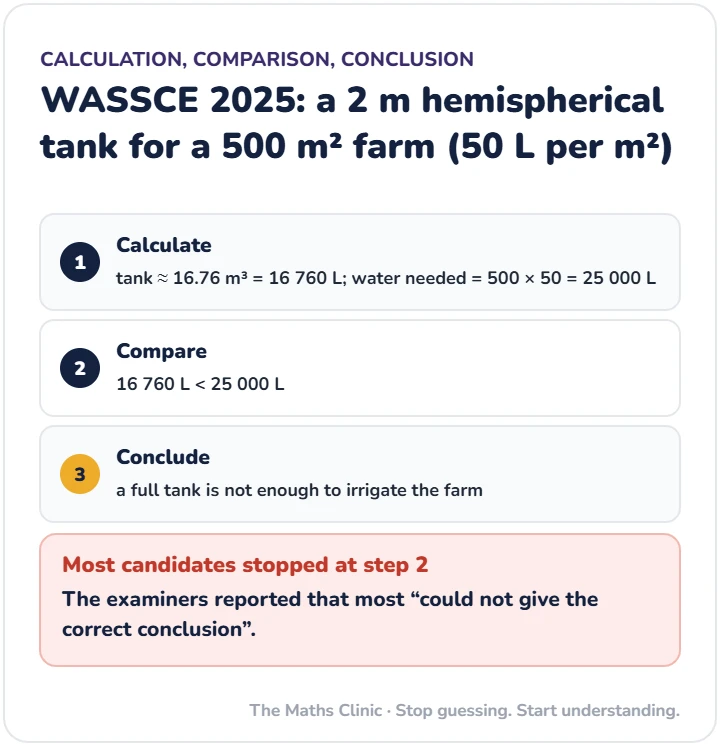
- Finish every question with a conclusion in words.
Source: WAEC Chief Examiners’ Reports, WASSCE (SC) 2025, Ghana: Mathematics (Core); WAEC Chief Examiner’s Report, WASSCE 2020, Mathematics (Core) and (Elective); WAEC e-Learning, General Mathematics WASSCE 2019.
What you’ll be able to do by the end
- Build frequency and cumulative frequency tables without errors
- Find the mean, median, mode, range and standard deviation, for lists and grouped data
- Use class limits, boundaries, widths and midpoints correctly
- Draw histograms, frequency polygons, pie charts and ogives, and read them with evidence
- Find quartiles, percentiles and pass marks from an ogive
- Interpret tables and charts and write conclusions that earn the mark
Statistics in one page
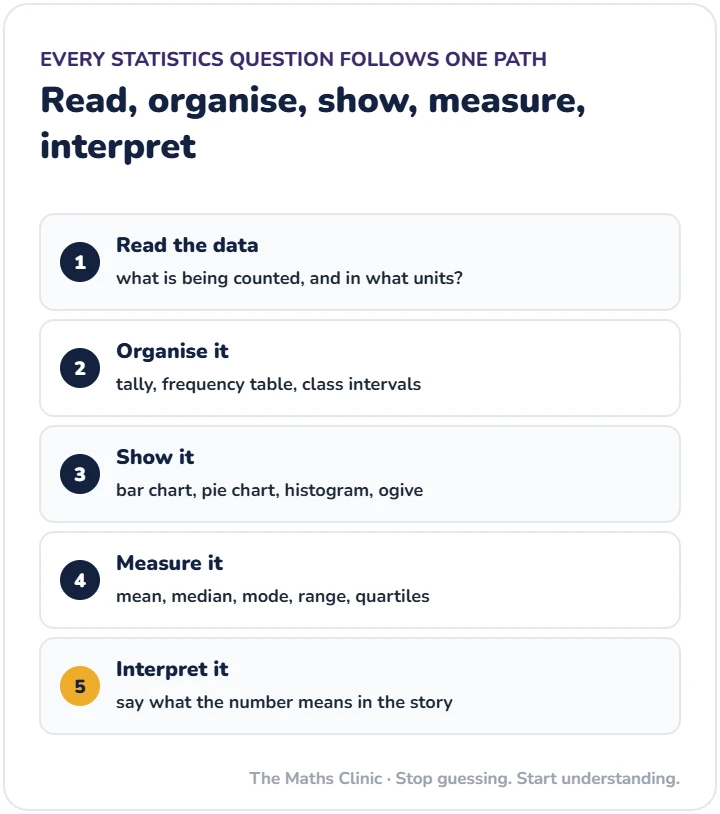
1. Tables and averages
Label every column, check Σf, and divide by Σf for the mean. Use midpoints for grouped data.
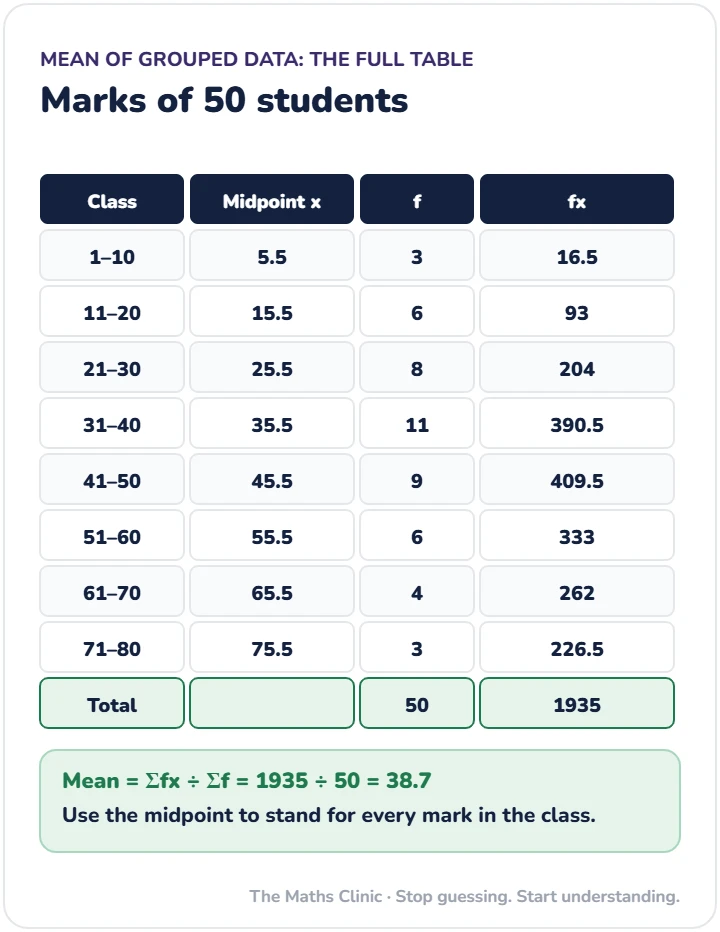
2. Cumulative frequency and the ogive
Running totals at upper class boundaries, starting at zero, joined by a smooth curve. Read with dashed lines.
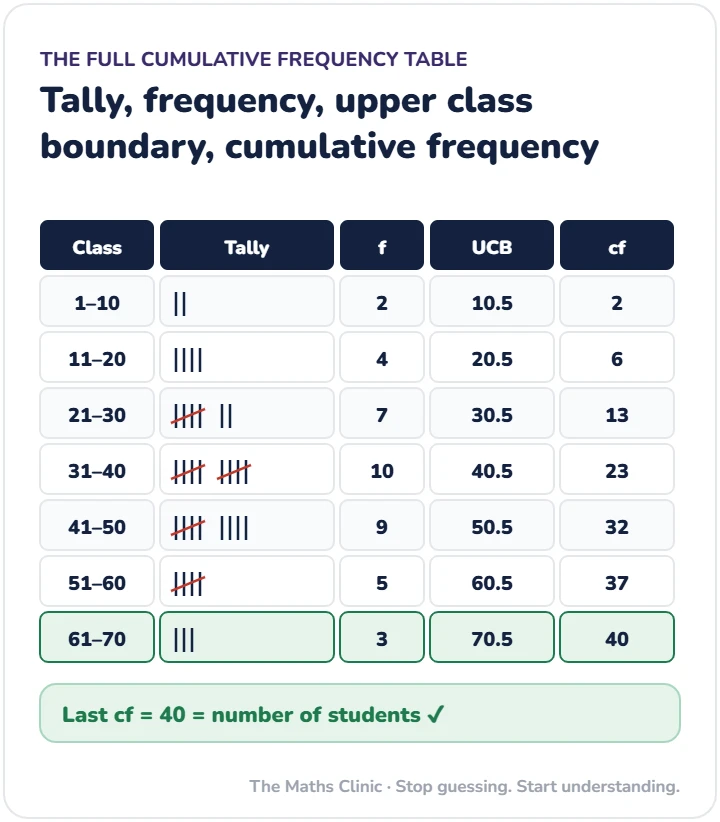
3. Histograms and pie charts
4. Conclusions
The lessons
The first Statistics Clinic lessons go live on 4 December.
🎲 Probability questions (dice, “at least”, “or” and “and”, Venn diagrams) are in the Probability Clinic, with lessons from 16 January.
Practise as you go
Find your weakest skill with the statistics diagnostic test once it goes live, then practise in the Practice Zone. Graph skills are also covered in the Graphs Clinic.
The mistakes examiners see most
| Mistake | Fix |
|---|---|
| cf column copies the frequencies | running total; last cf = Σf |
| Ogive plotted at midpoints or limits | upper class boundaries, start at zero |
| Median read with no lines | draw dashed reading lines |
| Mean ÷ number of classes | ÷ Σf |
| Histogram bars on class limits | class boundaries, no gaps |
| Calculation but no conclusion | finish with a sentence |
Questions learners often ask
Is statistics in every WASSCE Mathematics paper?
Yes. Statistics appears every year, usually in objective questions and at least one theory question.
Which lesson should I start with?
If statistics feels hard, start with Statistics for Beginners; otherwise start with the first lesson in the list and take the diagnostic test.
Where do these examiner comments come from?
From WAEC’s published Chief Examiners’ reports for WASSCE Core (and Elective) Mathematics, listed under sources below.
This clinic is part of How to Pass WASSCE and NOVDEC Core Maths.
Sources and further reading
These lessons are built on what WAEC examiners report year after year, matched to Ghana’s SHS curriculum.
- WAEC Chief Examiner’s Reports: the yearly reports on where candidates lose marks
- NaCCA SHS curriculum: the official Ghana Senior High School curriculum
- Ghana curriculum resources: official teaching and learning resources

Written by
Dickson Sarpong
NTC-certified SHS Mathematics teacher in Ghana with WAEC marking experience, and author of The Bridge Series textbooks. Every lesson here is built around the mistakes WAEC examiners keep reporting.
About DicksonStuck? Ask a question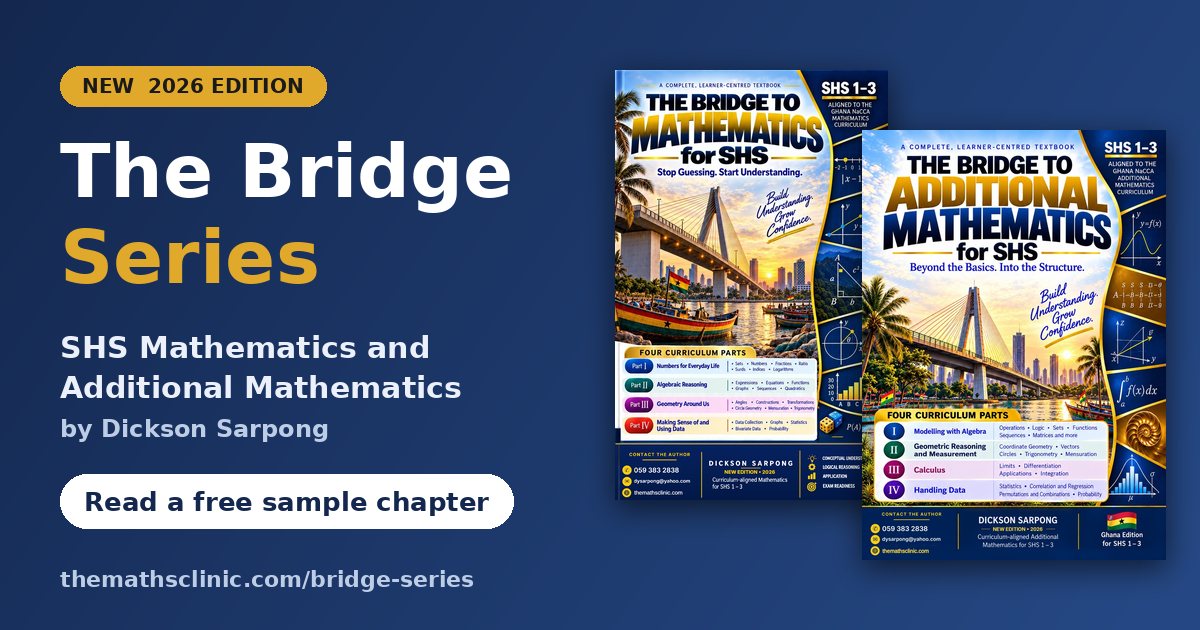
Want the whole topic, step by step? My textbooks, The Bridge to Mathematics and The Bridge to Additional Mathematics for SHS, follow the new curriculum and rebuild the basics as you go.
Read a free chapter →