Struggling with WASSCE Maths? Stop guessing. Let’s fix the gap step by step.
Graphs & Statistics Clinic
Free WASSCE Mathematics graph lessons: scale, plotting, reading values, gradient, quadratic graphs and cumulative frequency, one skill at a time.
Graphs carry a lot of marks in WASSCE Mathematics, and they lose a lot of marks too. Not because students can’t draw, but because one small skill in the chain is weak: the scale, the plotting, the reading or the interpretation.
The Graphs & Statistics Clinic takes those skills one at a time. Each lesson finds one gap, explains why it happens, and gives you practice to fix it, with diagrams you can follow on your phone. New lessons appear here every day.
What you’ll be able to do by the end
- choose a scale that fits and is easy to read
- plot points and complete tables of values without sign errors
- draw straight lines and smooth quadratic curves accurately
- read values from a graph in both directions, with guide lines
- find and explain the gradient and the intercepts
- build a cumulative frequency curve and read the median and quartiles
- protect every mark point in a WASSCE graph question
Graph work in one page
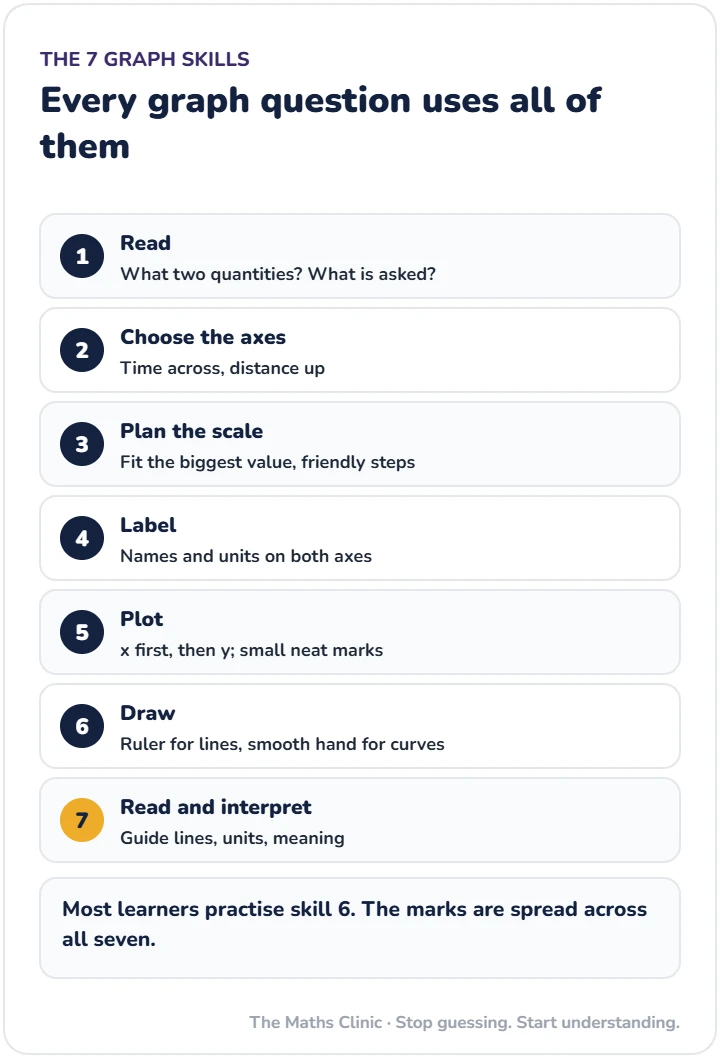
Almost every Core Maths paper has a graph question, and it carries marks at several points: the table, the scale, the plotting, the curve, the readings and the interpretation. Here is the whole skill in seven pictures. Each lesson below fixes one step properly.
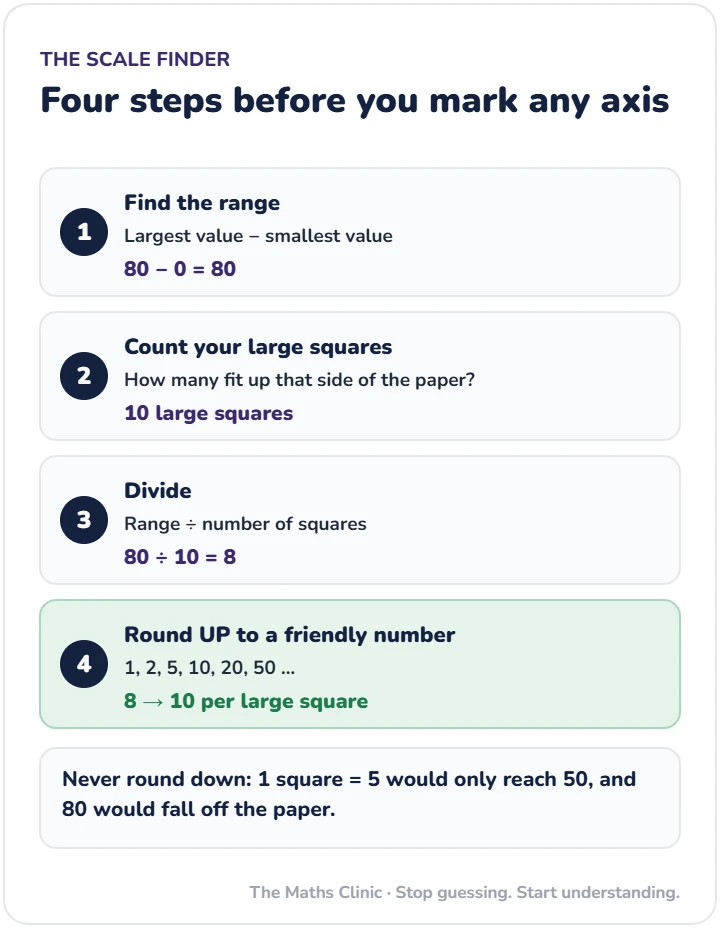
1. Plan the scale
Find the range, divide by the number of large squares, and round up to a friendly number such as 1, 2, 5 or 10.
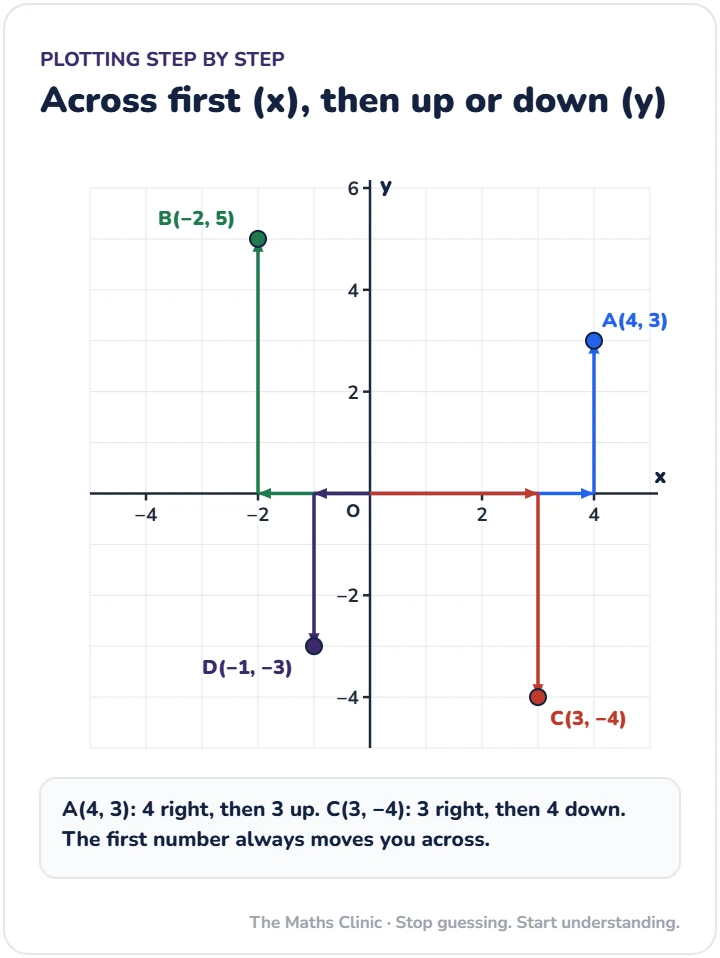
2. Plot accurately
Across first (x), then up or down (y). Check the signs and the quadrant before you mark the point.
3. Draw the right line or curve
Rule one straight line through linear points. Draw one smooth curve through quadratic points, rounded at the turning point.
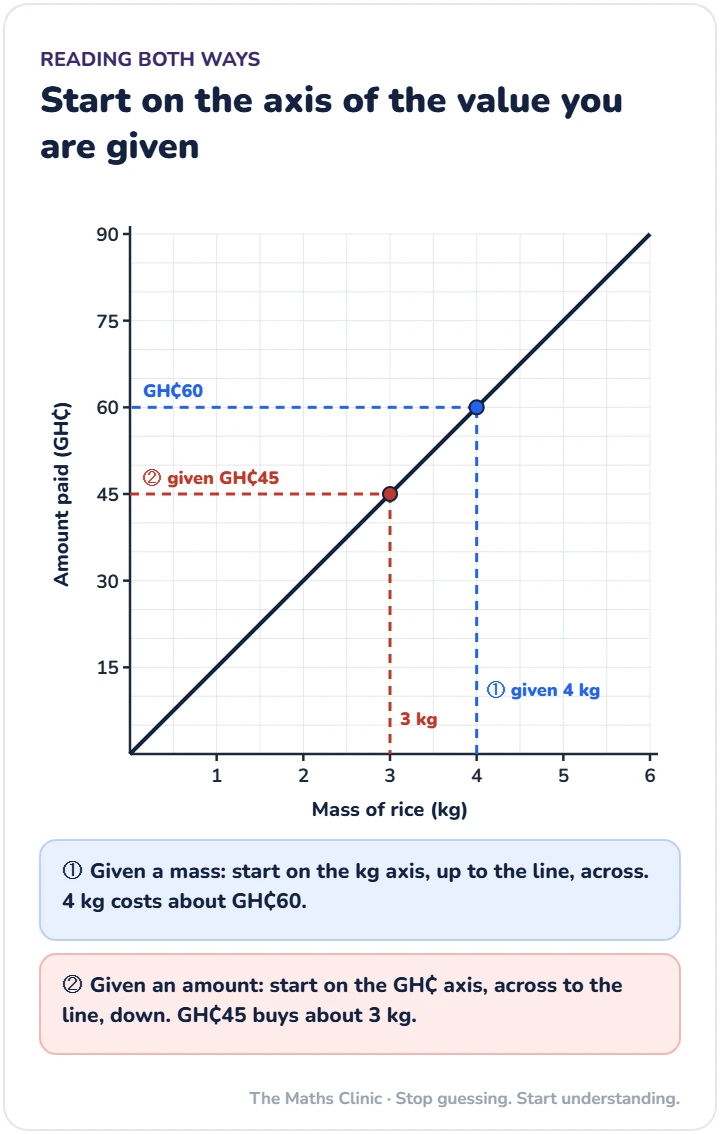
4. Read values with guide lines
Start on the axis of the value the question gives you, rule a line to the graph, then to the other axis.
5. Find and explain the gradient
\text{Gradient} = \frac{\text{change in } y}{\text{change in } x}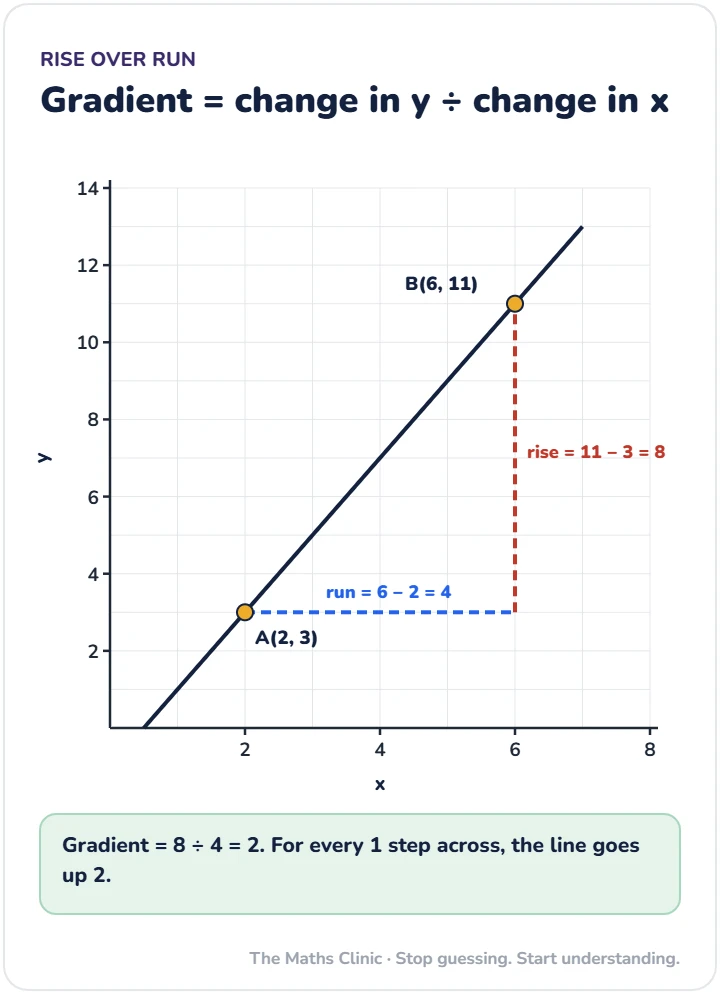
6. Statistics: the cumulative frequency curve
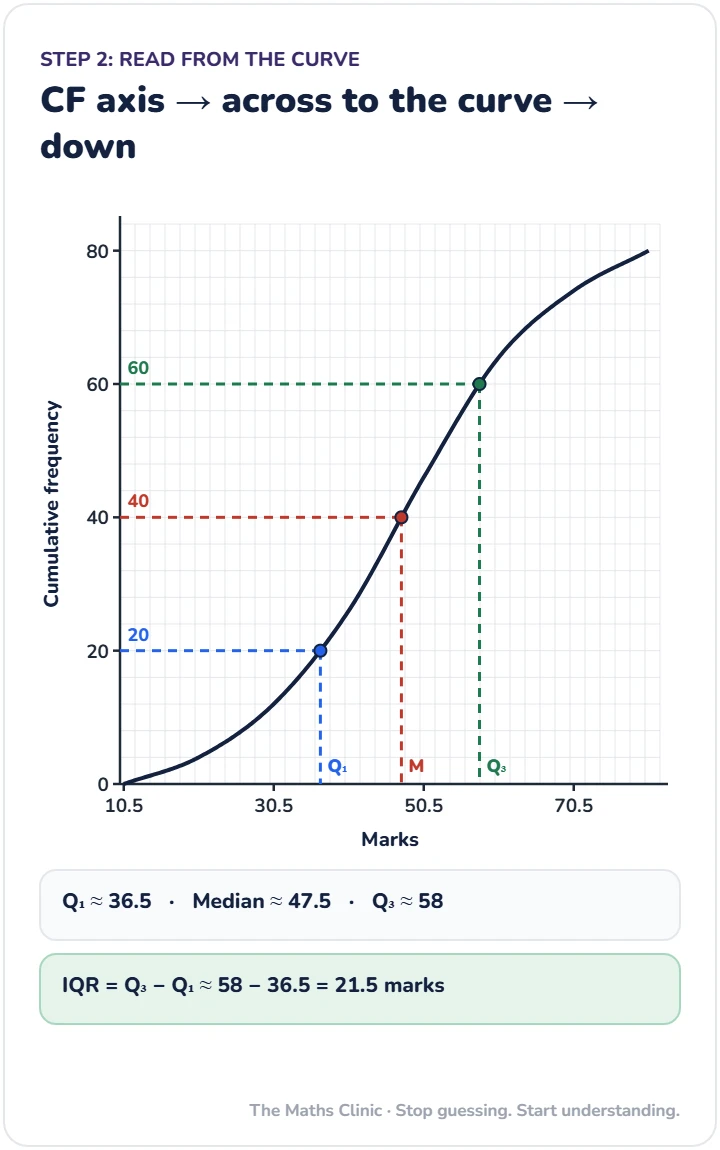
Plot running totals at the upper class boundaries, draw a smooth rising curve, and read the median from n ÷ 2 on the cumulative frequency axis.
The lessons
-
Graphs in Mathematics: 6 Mistakes Students Must Avoid
📚 Part of the Graphs & Statistics Clinic: every lesson on this topic, in one place. In many Ghanaian SHS classrooms, the moment a Mathematics question says “draw the graph” or “use your graph to find,” some learners become quiet. Not because they do not know anything. Many of them know the formula. They can… Start this lesson →
Practise as you go
After each lesson, try the graph reading questions and the statistics questions in the Practice Zone.
Not sure where your graph work breaks down? Start with Find My Gap.
The graph mistakes examiners see most
| Mistake | Fix |
|---|---|
| Scale chosen after plotting starts, or changed halfway | Plan one scale for each axis first |
| (x, y) plotted as (y, x) | Across first, then up |
| Quadratic points joined with a ruler | One smooth curve, rounded at the bottom |
| Values read by eye | Ruled guide lines, counted small squares |
| Frequencies plotted instead of cumulative totals | Running totals at upper class boundaries |
| No units or interpretation | Say what the value means, with its unit |
Questions learners often ask
How do I choose a scale for a graph?
Divide the range of values by the number of large squares available, then round up to 1, 2, 5, 10 or 20 units per square.
How do I find the median from a cumulative frequency curve?
Find n ÷ 2, start at that value on the cumulative frequency axis, go across to the curve, then down to read the value.
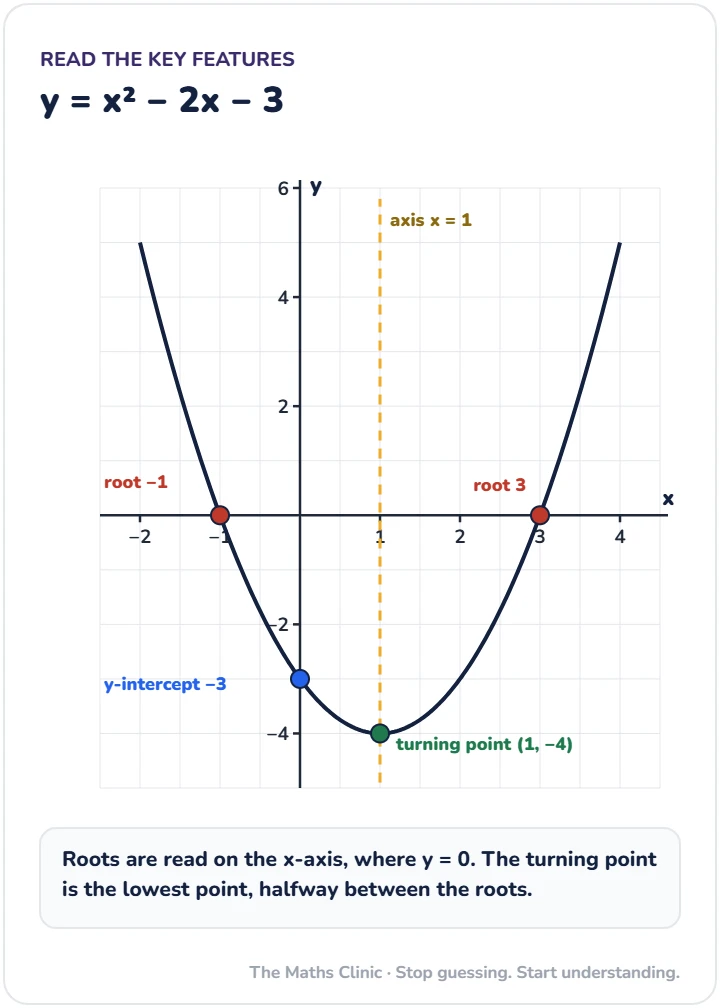
Where are the roots on a quadratic graph?
Where the curve crosses the x-axis, because y = 0 there.
This clinic is part of How to Pass WASSCE and NOVDEC Core Maths.
Sources and further reading
These lessons are built on what WAEC examiners report year after year, matched to Ghana’s SHS curriculum.
- WAEC Chief Examiner’s Reports: the yearly reports on where candidates lose marks
- NaCCA SHS curriculum: the official Ghana Senior High School curriculum
- Ghana curriculum resources: official teaching and learning resources

Written by
Dickson Sarpong
NTC-certified SHS Mathematics teacher in Ghana with WAEC marking experience, and author of The Bridge Series textbooks. Every lesson here is built around the mistakes WAEC examiners keep reporting.
About DicksonStuck? Ask a question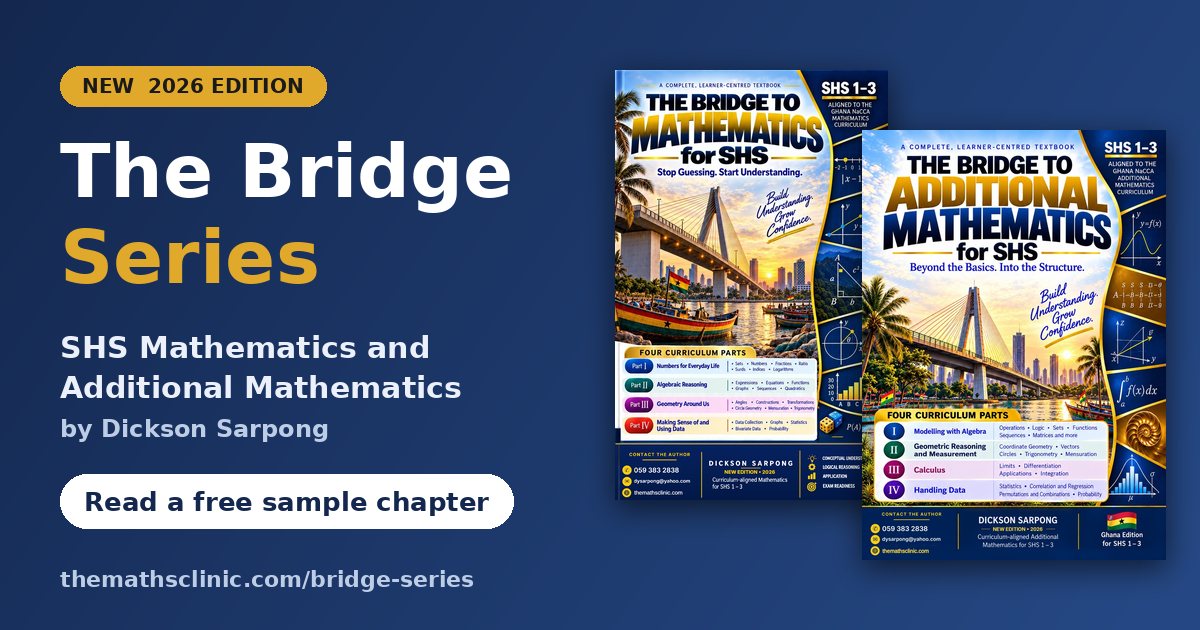
Want the whole topic, step by step? My textbooks, The Bridge to Mathematics and The Bridge to Additional Mathematics for SHS, follow the new curriculum and rebuild the basics as you go.
Read a free chapter →